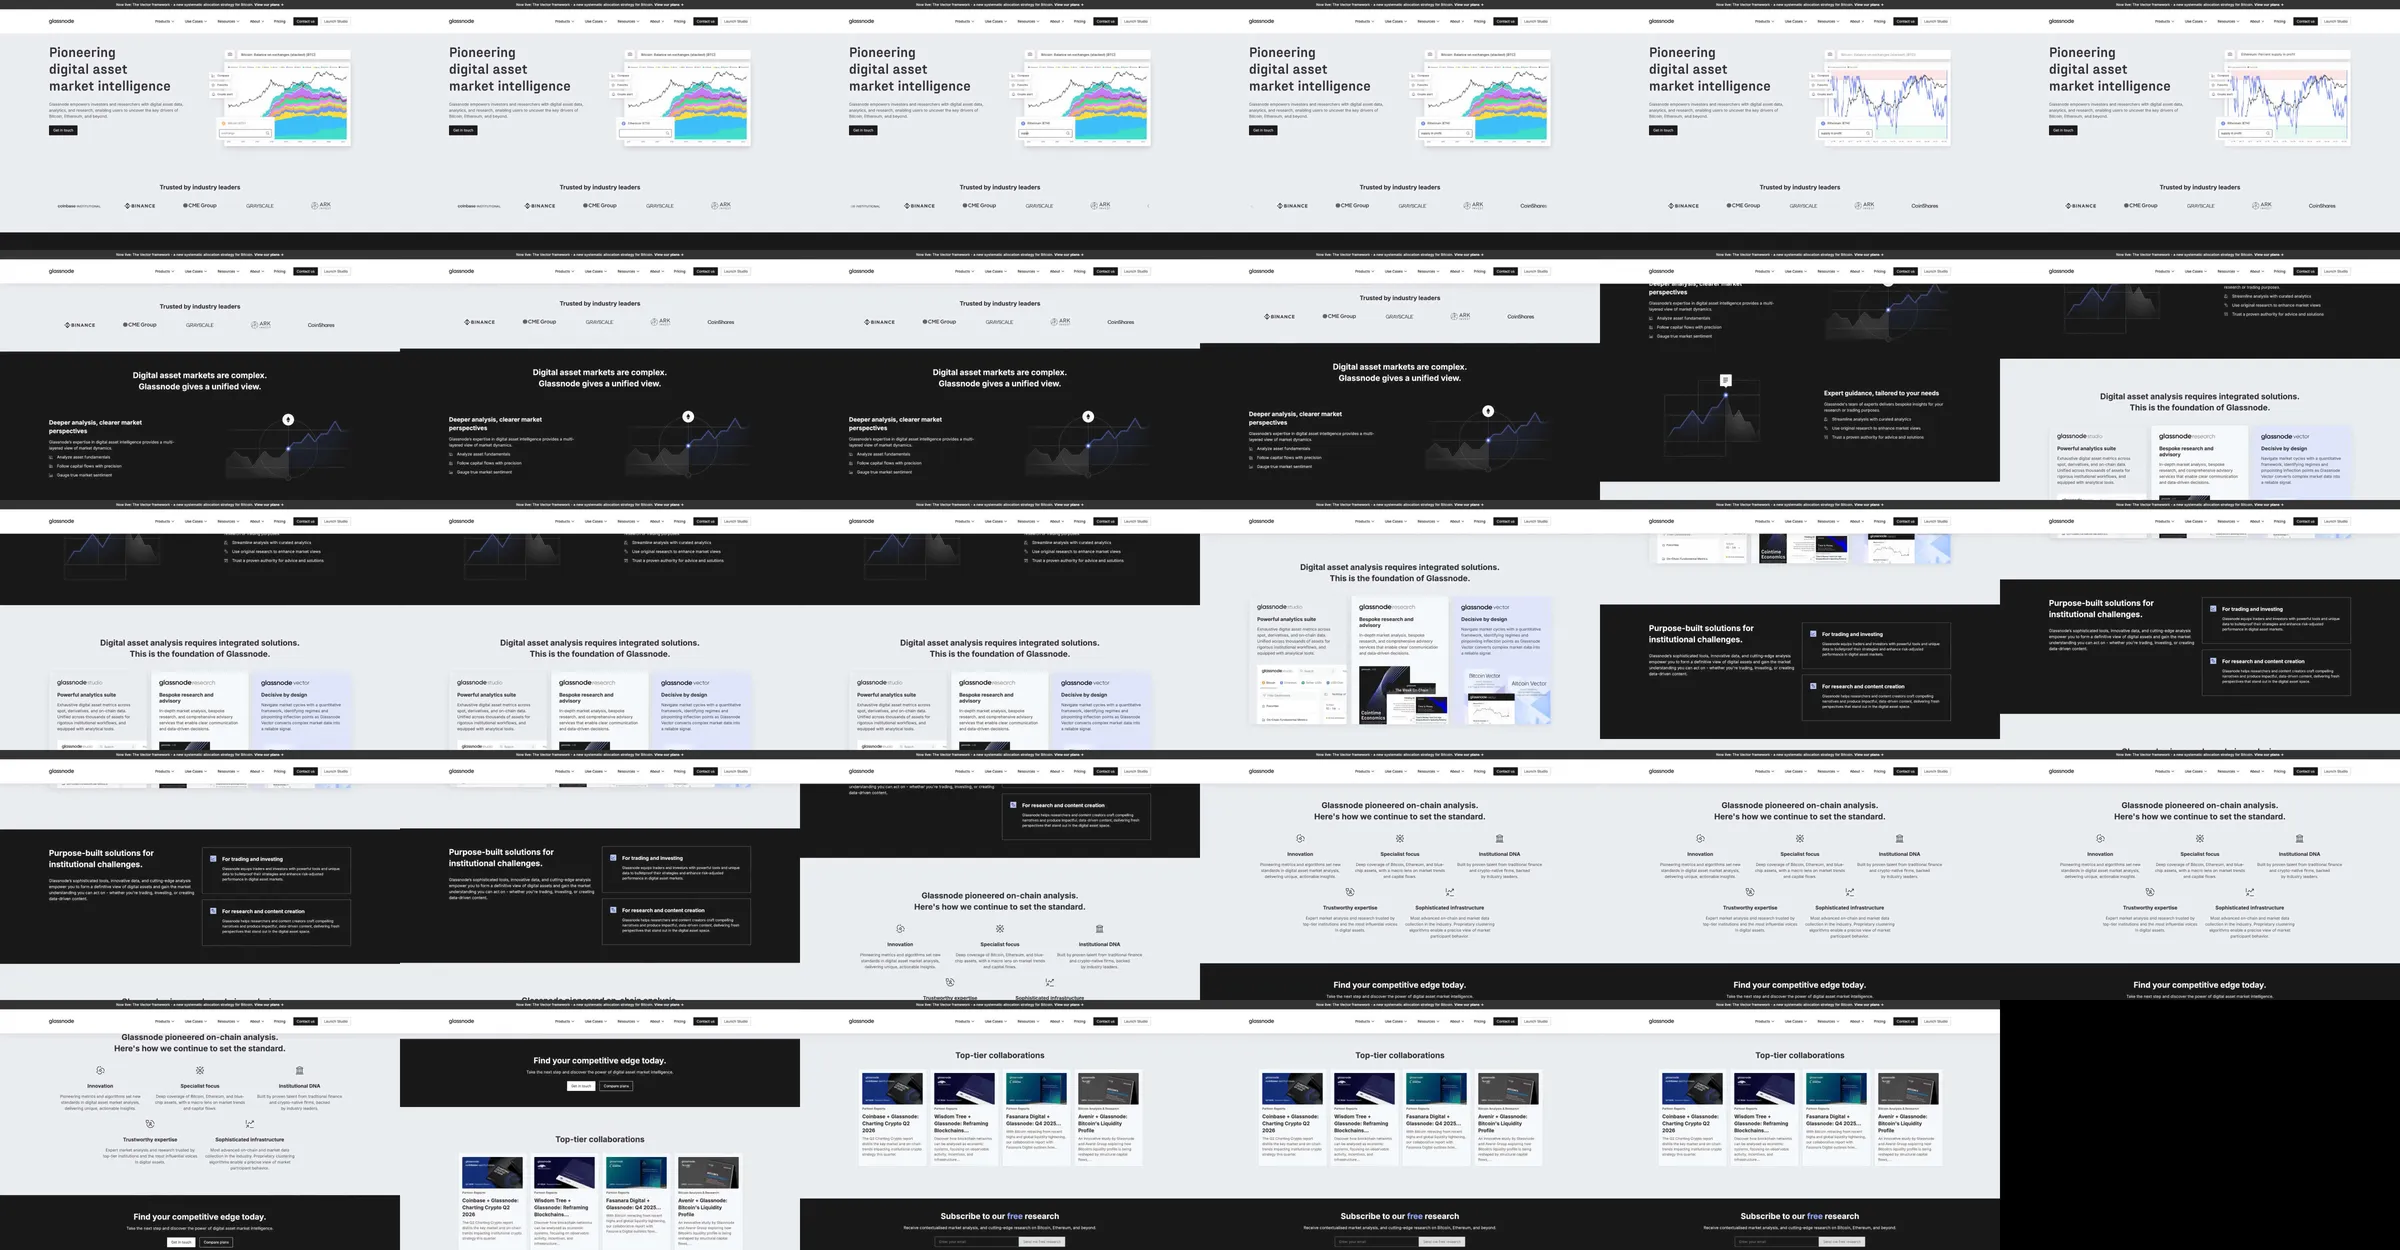
A digital-asset analytics page that sells insight through the density and range of its charting product.
1. Chart-led hero. 2. Market data and on-chain metrics. 3. Analytics workspace examples. 4. Research and subscription close.
Charts are the product evidence, and light/dark alternation separates reading contexts. Small axes and labels need focused views.
- [Refero style page](https://styles.refero.design/style/a79b6a74-6b67-4c9f-9d69-bff80869b943) and its [recorded MP4](https://images.refero.design/styles/refero.design/video/995cbad4-8e47-48c8-b638-31e0737202a4.mp4) supply the sampled motion and section sequence. - The live capture at https://glassnode.com/ supplies current copy, responsive screenshots, and measured layout. - The live page now describes digital-asset market intelligence more broadly; its current copy takes precedence.