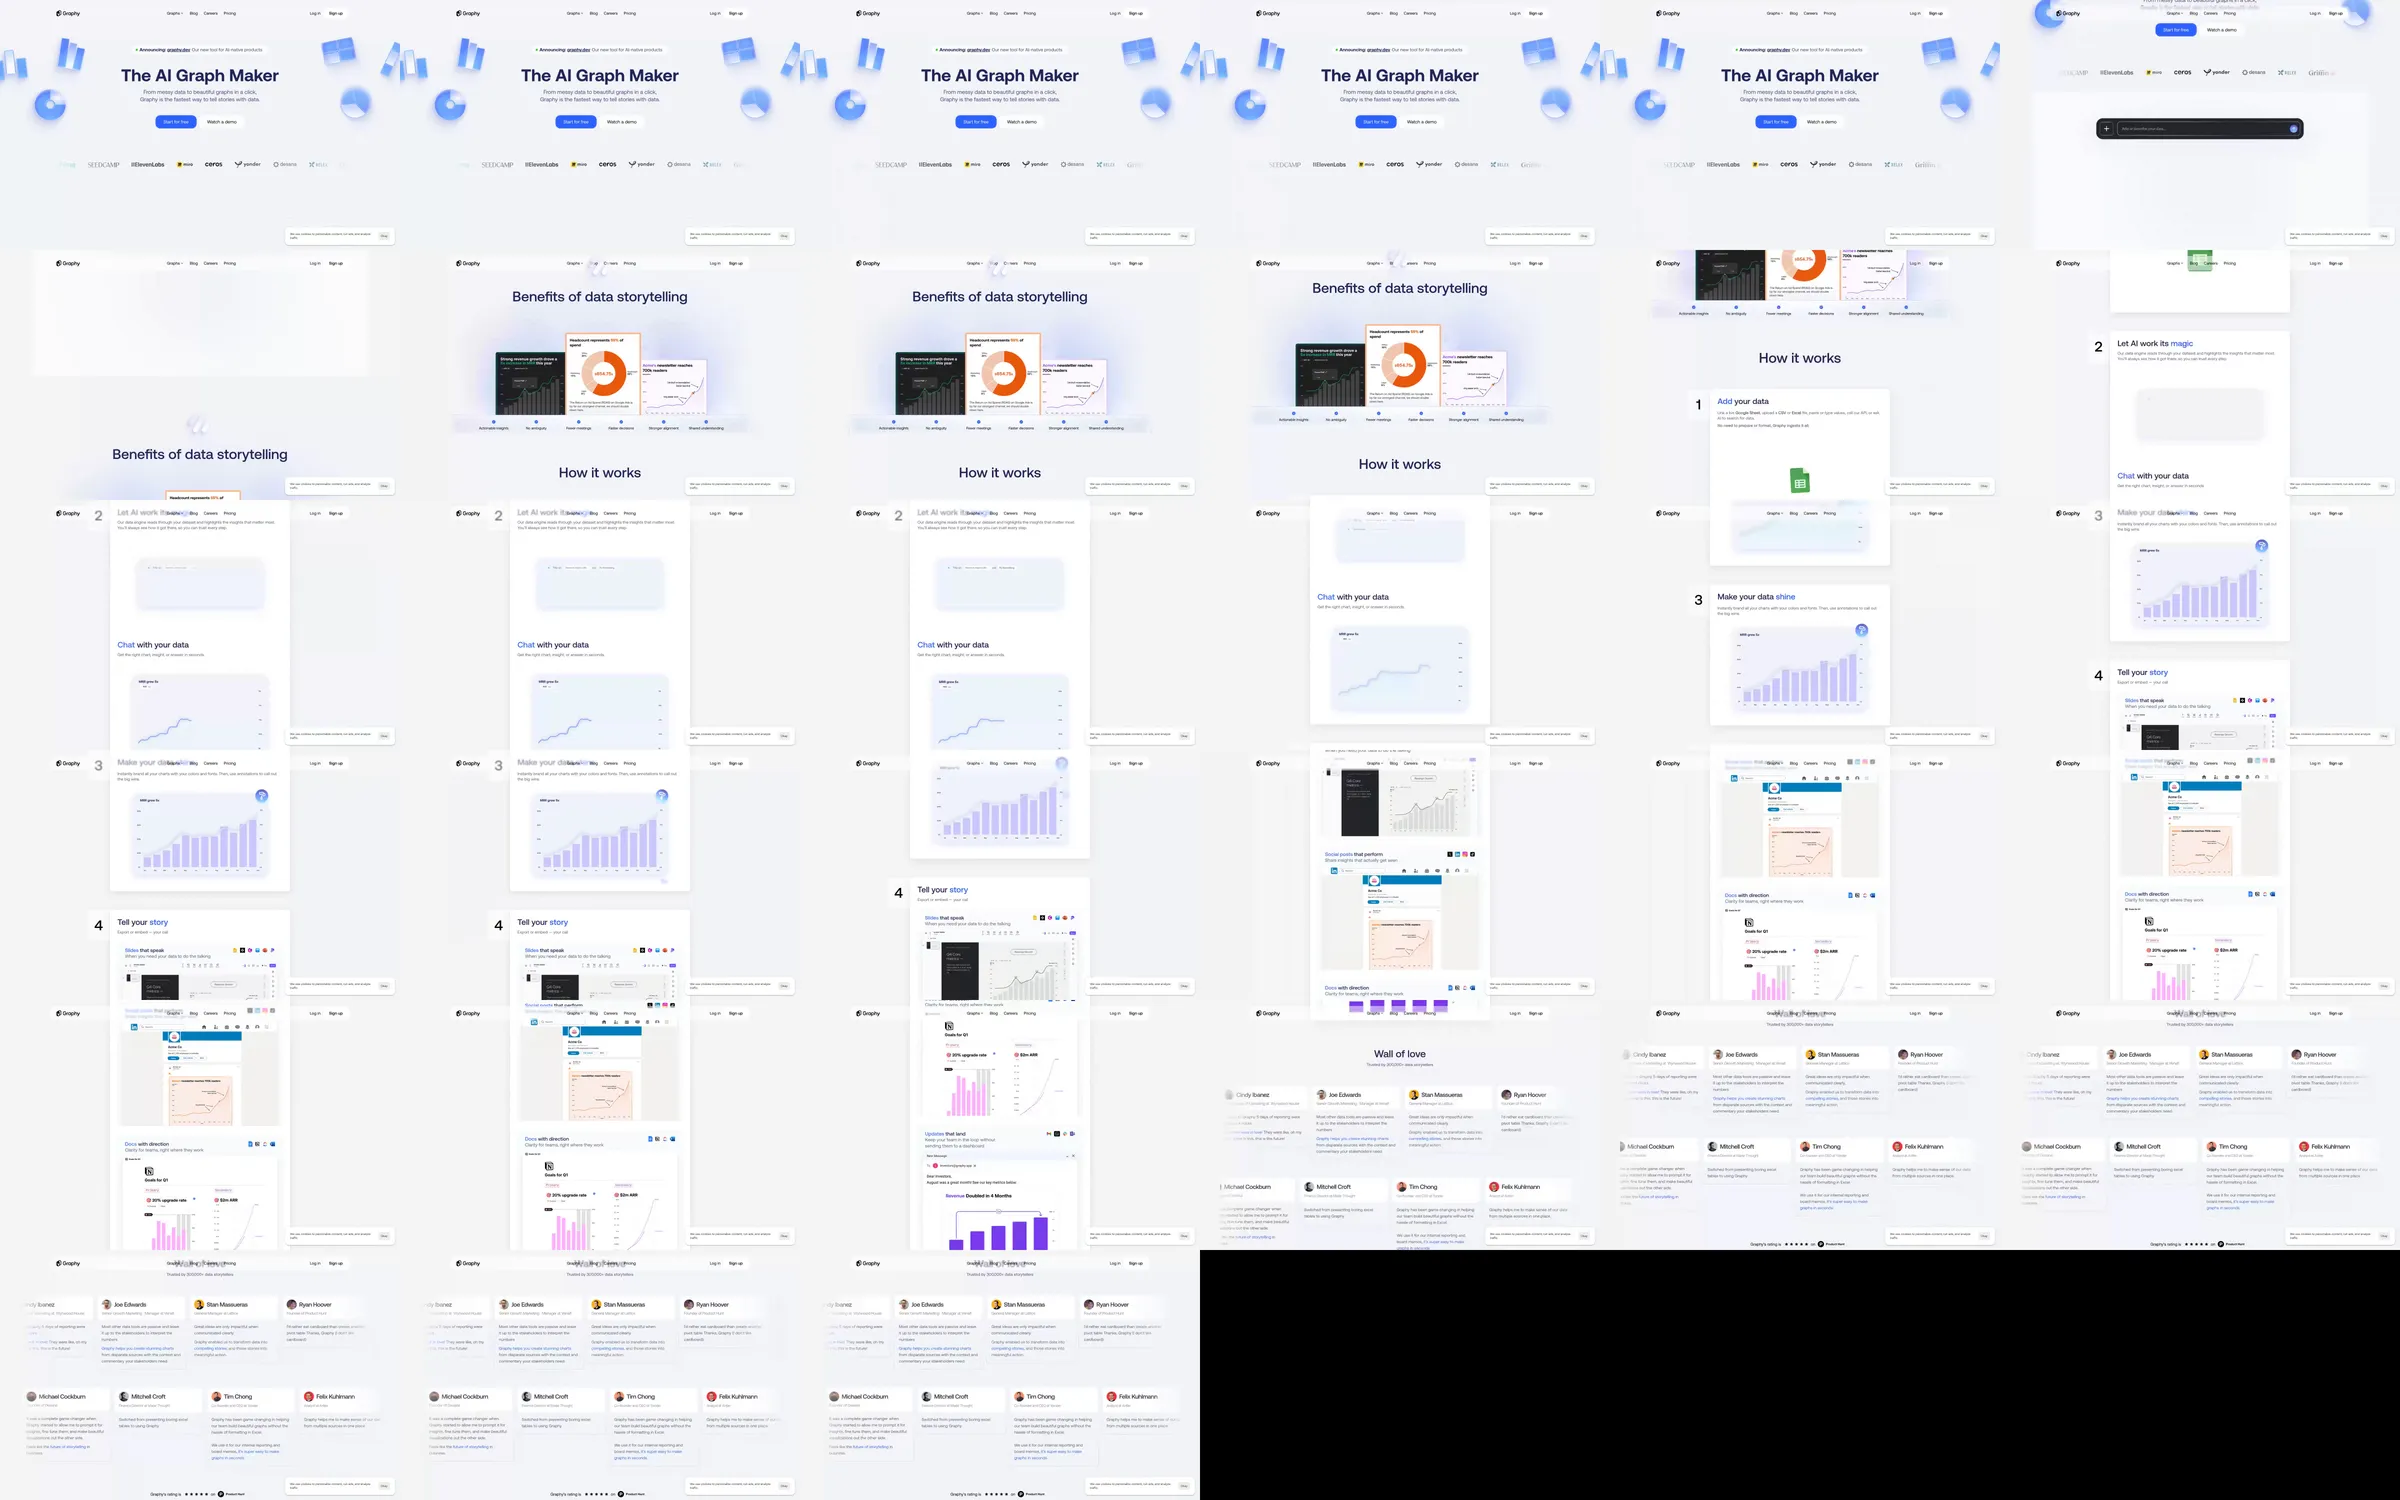
A data-storytelling tool page that moves from raw inputs to clear charts and shareable narratives.
1. Floating graph-object hero. 2. Data input and AI generation. 3. Chart styling and sharing. 4. Team proof and start action.
The abstract blue objects create a light entry point, and real graph screens quickly explain what the tool outputs.
- [Refero style page](https://styles.refero.design/style/7f9eabb2-3f76-477d-849f-e868e698f421) and its [recorded MP4](https://images.refero.design/styles/refero.design/video/473a353a-99cd-4658-a8ab-78a6b03af7be.mp4) supply the sampled motion and section sequence. - The live capture at https://graphy.app/ supplies current copy, responsive screenshots, and measured layout. - The live site adds current AI-native product messaging; the recorded strip shows the broader feature tour.